Pagina's op IkLeerBIM

vrijdag 6 december 2019

Fun with heatmaps

Today something fun, and who knows useful.

In an age of generative design a heat map can give a human perhaps a different kind of insight.
A heat map is as a surface with a colored gradient. And the colors represent a value, or even a wright and a wrong. The nice thing about a colored gradient is that the computer does the interpolation based on the actual calculated values. Off course in real life some of those values are not valid. And of course it is a very rough way to make decisions. But it does give some visual feedback. And it is based on calculations and not rules of thumb.
So let’s do this!. And make some heat maps in Dynamo and Revit. See what happens. And what works.


First Dynamo
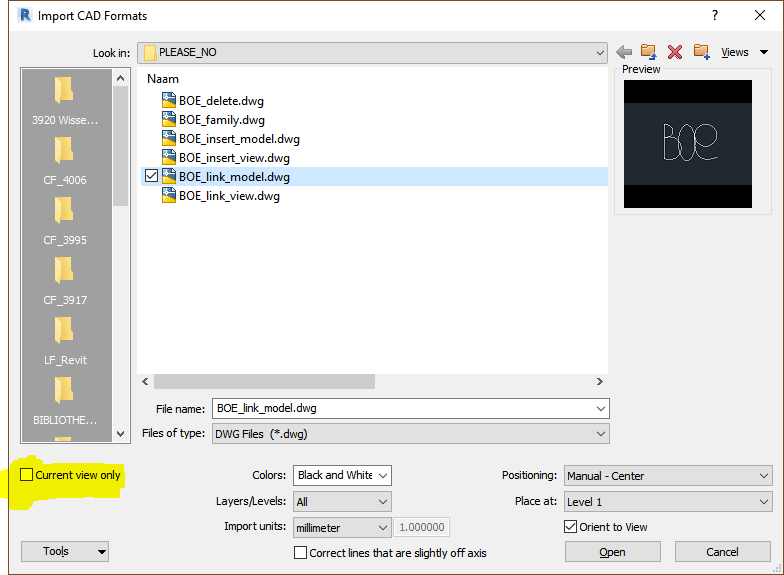
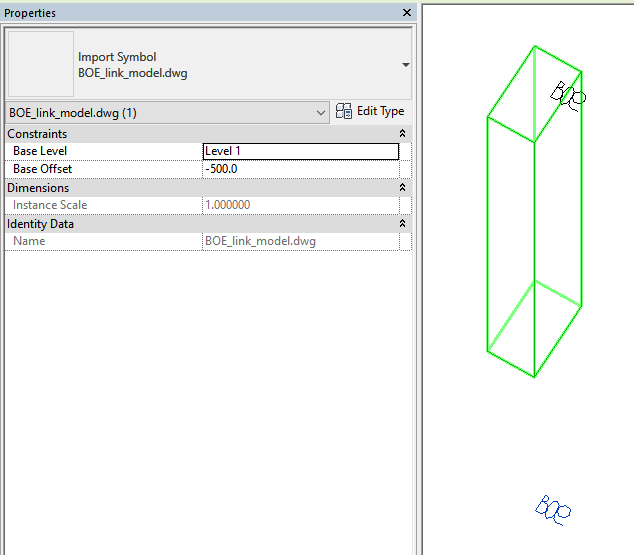
For a heat map you  first need a surface. So let’s select a Face from an object in Revit.
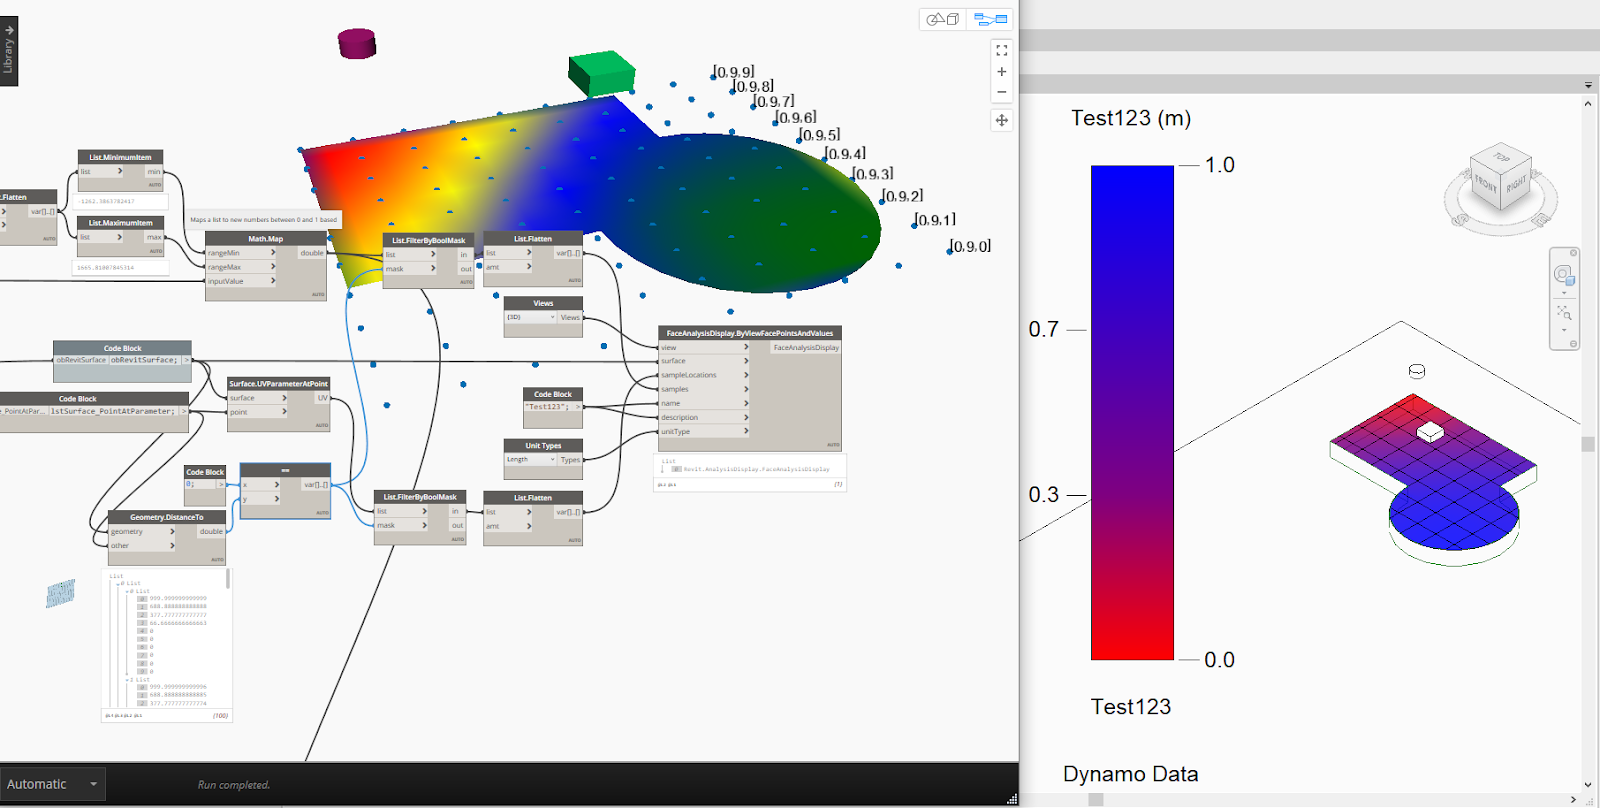
Now the first thing you need to know about generating a heat map in Dynamo is that you need a matrix (list of list) of points. The list of list must be with the same lengths and offsets. So in normal language. Create a bounding box based on the surface. Convert this into real geometry. Explode this to grab the bounding surface. And that is where we are going to work with.  We divide this new surface into points. This can easily be done with Surface.PointAtParameter based on a UV. Both the U and the V are lists between 0 and 1 with equal steps for both in the U and in the V directions. The UV is like the local coordination system for the new heat map. The generating heat map needs this environment to work correct in Dynamo. Some points are on the Surface and some are not. This works differently in Dynamo and in Revit. But we will get back on that later.
So we have a surface and a list of list of points. Based on a bounding UV system.


Now let’s make Dynamo work!
Just for starters we will calculate the distance between each of these points and another object in Revit. In order to map each value to a colour in a color range between 0 to 1, we also need to map all the values between 0 and 1. Now we can find the right color for each value with the Color Range Node. At this moment each distance has a corresponding color. And this color is related to a UV position on the bounding surface because of the list structure. So when we connect this list of list of colors to the surface. We get a correct heat map. Points outside the surface do not matter for the GeometryColor.BySurfaceColors Node. Actually this Node needs all the UV points of the 2D bounding box to work correctly.


When we move the object in Revit the heat map in Dynamo will change. Nice… :-)
Off course we can also tweak the color range a little. The indices do not to be equally divided between 0 and 1. As long as there are as many colors as indices it will continue to work.


Because it is still a list of list with values. You can do some simple math and relate multiple heat maps to each other. Like the points nearest to object 1 AND object 2. Or the points nearest to object 2 and greatest distance to object 1. Off course this examples are not really difficult. I simply show how this works.

Now let’s take this heat map to Revit.


If we want to use the same points and values to create a heat map in Revit it does not work. We need to filter for points that are actually on the surface. This is the first thing  that is different. And another thing is that we need a flatten list.


Of course Revit has its own View Visibility settings that also need to be correct to show the heat map. We need to create (or select) a Graphic Display Style – you can try different settings-. Be sure that Analysis Result Settings are also set. Also be sure that your kind of view is able to show the heat map –like 3D views-


Back to Dynamo.
There is more we can do while visualizing our calculated data. What about getting the contour of an area that is better (or worse) than a specific value? That is an interesting concept, I think. Because In the end you want the computer to understand that we are pinpointing things to a specific area that make sense. Jus in order to (visually) lower the endless combinations in front, while doing some generative design.
It gives us also other ways to visually or mathematically examine our results. Like the value at a specific point, based on interpolation. Or the slope – the difference between values in an bigger or smaller area. There are times that you best can generate millions of options –because it is simply too difficult to explain or program- And there are times when you are trying to find an optimum between the latest and doing things completely manually.

To do this we can e.g. create a 3D visualisation of the values and generate new meaningful geometry based on our wishes. Let’s start this by creating new points, based on the original grid of points and an Z-offset, based on the value of each point.  You can create lines while connecting the original to the new points. Or create nurbscurves while using only the new points in the list of list. Some points will intersect because they do not have a ‘value’ so if you want to, you can filter those, or simply ignore the warning.


Create a solid while using the perimeter curves of the original surface and the new top surface.
And finally slice this new solid at a certain level.
Now we have a new piece of geometry that is roughly defined by calculations off a grid of points and a value filter. The slicer is not really fast... but it works.


Of course this is not all new.
ArchiLab has also some nodes. Here is an old post where he is playing with LadyBug and Mantis Shrimp

And then there is the SpaceAnalysis Package. Build by Autodesk Research. A package that can do some efficient tricks just out of the box. It has some wonderful solutions for Pathfinding (better than calculating the straight line distance in our example)), Visibility / Field of view and Acoustics.


I am happy to say that it is not really difficult to use. First you have to make a Space Lattice with the Node SpaceLattice.ByBoundingBoxAndLines. This node needs a bounding box (now you know), some barriers (real barriers, or the contour of the surface, or an empty list – but why would you) It is possible to enter a list of Revit lines, but also line based Revit families. Remember that curved lines do not work. In that case use Utils.ApproximateCurvesWithLines. And last but not least a resolution input. Take care of this one! This is a distance input and the default value is 0,2. Beware! Your script will probably not break. And when this node is finally finished you have a very detailed Space Lattice. When you first try this workflow make this input bigger than the default. Or try something like I did to reduce the points.


There are a few nodes that will show this Space Lattice. It contains of a grid of points. And all the points are connected with lines in maximum 8 directions. By walking and counting these lines you will have an idea how far points are apart. Especially if you see that the Space Lattice does not make these lines if they intersect with your barriers. Well in the end the shortest path is a fundamental science problem. Google Dijkstra’s algorithm if you are up to it. It can be fun to know at least some basics.


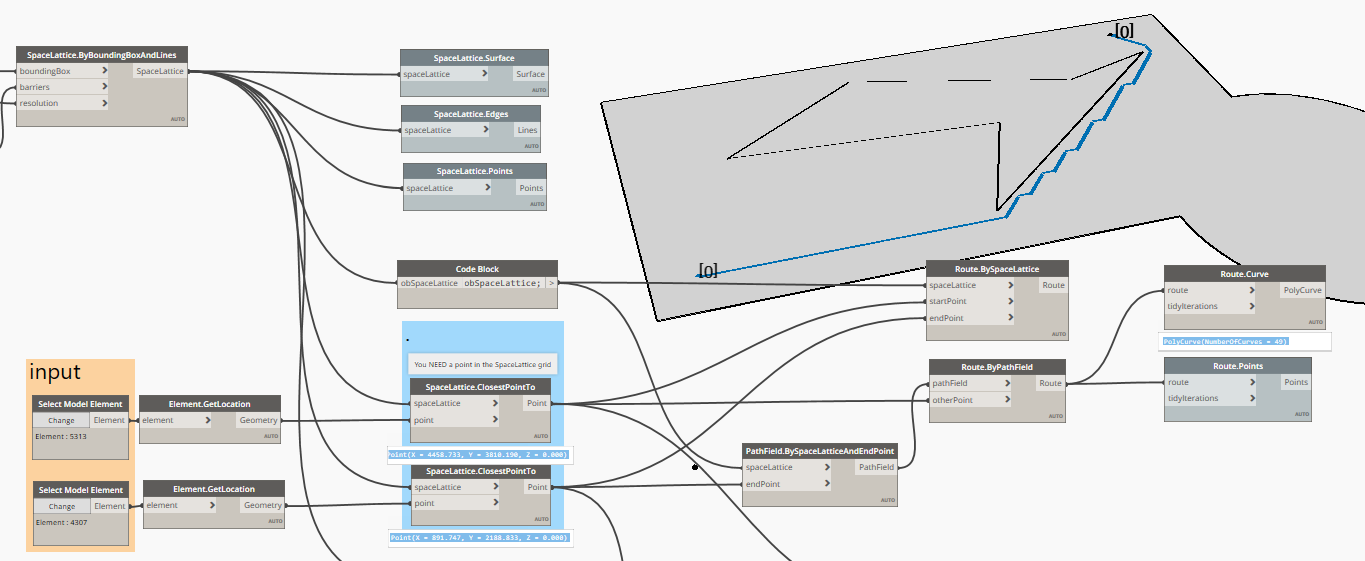
Because of this Space Lattice, you have to relate your input points to this Space Lattice with the node SpaceLattice.ClosestPointTo. At least that is what I think is best.


It is easy to find and visualize the shortest path. A nice addition is the tidyIteration to make the path more smooth. You probably want to do this if you do not use so much calculating points.


The field of view is only a few nodes. Here it is also possible to relate multiple results by using Union and Intersection. And there is also a node to get the value at a specific point.

Of course you need to do some tricks to get this visual into Revit, as described above.


Here you can find the scripts SpaceAnalysis_test.dyn and Heat_map_test.dyn so you play around.

vrijdag 25 oktober 2019

Where is my DWG !!

There are a lot of things on my bucket list. And this post is one of them. One down just a few to go.

Of course we never use DWG. And of course we always use them in the ‘right’ way… But still, ones in a while I get this question: “I think there are a couple off DWG's in my project. But I do not know the status. And basically I also do not know where they are. -small voice- Help”

So let me showcase some things about DWGs in Revit.
You can Import or Link a DWG. And you also can Import a DWG in a Family.
When you insert a DWG you can choose to insert it in a View (= 2D annotation) or as 3D Model information.
A 2D annotation DWG has the option to put the DWG in the background or in foreground. And a 3D DWG has a 3D Z-position that will influence the visibility
After that there are a lot of ways to change the visibility but that is not part of this blogpost. Because today we wants to find DWG’s and kill it if necessary. 😊 By killing it I do not mean explode the whole thing -which will be showcased nevertheless- but removing absolete ones. And regain control over your project, so everything is zen again.

Let's start with Linking in current view only - just as we learned
Use foreground or background to change the visibilty
Now let's try linking it as model information
By changing the offset related to the reference level of the DWG you can change the visibility
And yes the DWG is actually there in 3D
Even in your Section or Elevation...
I did the same thing but then bij inserting DWG's by view and in 3D
Now we got 4 DWG's in different ways in our project. None of them can be found in the browser
And only the linked DWG (by view) can be found in the manage lnks dialog
But there is MORE. You also can import a link in a Family. And let's try exploding 1 off them -just for kicks-
The visibility of the inserted DWG in de Family is based on annotation options - like draw in foreground
The visibilty options of the exploded DWG in the Family is based on model information
Only the lines of the exploded DWG in the Fanily are visible in 3D when loaded in the project.
Under Imported Categories you will only find the layers of the not exploded version of the DWG in your Family
The exploded DWG in your Family is part of the Family Category. So there are new Sub Categories created
When I copy the 4 different DWG in my project and try to explode those -I know- It is only possible to explode the 3D model versions and the 2D inserted version. -what have I done!- The 3D versions turn into 3D model lines
And of course the view dependent DWG version turns into detail lines. At this point your Revit model will be poluted with strange linetypes etc. based on the original DWG. At least some people will hate you for that. I you really have to explode a DWG. Do this in a clean new project. Change all the created content in the right Revit ones based on your company standard. And copy this 'clean' result to your project.
Yes you get really model lines
Back to our subject. There is still only 1 linked by view DWG in your manage links.. UI menu
When changing the original DWG only the DWG link by view is changed. This is also the only one that would show up in the manage links UI
  So resume:
  • Exploded versions are part of your model - deal with it -
  • Only the Linked by View version has interaction to a DWG file outsite Revit and can be checked for  a Date etc. Others are frozen versions of a original DWG.
  • You can grab the 3D versions of DWG easily in multiple ways. One is by selecting everything in a 3D view and use the filter option.
  • Inserted 2D versions are much harder. You need at least some help. There should still be some addin around. And otherwise Dynamo can be handy to find the related views. Or even create a Selection set with the help of Clockwork -as always-
  • you can get some testfiles https://bit.ly/2PeE31z


vrijdag 13 september 2019

Revit / Computer nauwkeurigheid

Seeing is believing they say. So here it is.

De 'floating point error'.

Revit / Computer nauwkeurigheid
(o ja, een slotje helpt ook niet hoor)
Dit is een belangrijk gegeven voor programmeurs en 'rocket scientist'.
Maar voor bouwkundigen die een normaal gebouw maken, betekend het vooral dat je geen 6 of meer  decimalen moet willen gebruiken in bijvoorbeeld Revit of een ander bouwkundig modelleer pakket!

Wat is die 'floating point error'?
In het kort (meer zinnigs kan ik er toch niet over kwijt.. en anders google je het maar zelf)
Een computer slaat alles op met 0 en 1, dus ook getallen. Normaal gesproken worden daar 32 of 64 bits voor gebruikt. Punt is, dat het aantal bits beperkt is. En een ander punt is dat deze binaire manier van opslaan 'lastige' decimale getallen kent die je eigenlijk niet met dezelfde nauwkeurigheid kan weergeven als dat we in ons bekende decimale stelsel gewent zijn. (test hier zelf wat decimale getallen zoals 0,1 of 45,45)

Dus zomaar een eenvoudig voorbeeld. 1 Delen door 3. En later het (afgeronde antwoord) vermenigvuldigen met 3, geeft geen 1 meer. Tenminste niet als je zelf het aantal decimalen wat je ziet verhoogt.
Bij het rekenen met hoeken hebben we het getal Pi nodig. Ook dit is aan benadering.
Zo zou je nog wel meer voorbeelden kunnen verzinnen.

Natuurlijk klinkt dit allemaal meer schokkend dan dat het in werkelijkheid is.
Gebruik je verstand. En vraag geen onmogelijke dingen van de computer.

dinsdag 30 april 2019

Gelezen - Een uitstekend stuk over Dynamo op Punto Revit

Vandaag kwam ik een uitstekend stuk van Paolo Emilio Serra op zijn blog Punto Revit tegen

De blogpost zelf
http://puntorevit.blogspot.com/2018/12/dynamo-primer-slide-deck.html

Op zijn blog zelf kun je onderaan een download naar zijn presentie vinden.

Het is een enorme hoeveelheid tekst, maar erg aan te raden Het eerste deel is uitstekend voor beginnende Dynamo gebruikers. Maar ook gevorderde Dynamo gebruikers die hun kennis willen verdiepen of willen snuffelen aan Design Script en Python zullen verhelderende voorbeelden vinden in het tweede deel of meer achterin. Sla gerust pagina's over als er 'niks nieuws' staat het krijgt steeds meer inhoud.

Ik vond ook wat stukjes huiswerk.
Bijvoorbeeld hoe je een net stukje script met Python maakt. Ik verwacht er niet mijn geld mee te gaan verdienen maar zou toch graag wat meer structuur in mijn Python scripts willen kunnen maken. https://www.python.org/dev/peps/pep-0008/ 

Top Paolo! Hier heb ik wat aan.

Hieronder een samenvatting: 

vrijdag 1 februari 2019

Generating Fire Compartment floor level boundary elements with Dynamo

Omdat het kan, en misschien ook wel omdat het soms moet...


Voor de mieren...
Alleen de onderliggende level heeft een correctie gekregen voor een extra sparing uit een ruimte
Je kan natuurlijk ook op een andere manier Revit content maken en meer eigenschappen aanpassen. Dit is een snelle en dirty oplossing. Je kan natuurlijk ook een Floor maken.
Je kan Rooms uit een Linked model halen. Maar niet met de native nodes de Boundary van een Room. Overigens wel weer de 3D geometry.
De Room.CenterBoundary is meer logisch om te gebruiken. Maar dan zie je de vorm van de ruimtes  niet meer zo goed in voorbeeld...
Voor het voorbeeld heb ik alle Rooms gepakt. En die zitten toevallig op 2 Levels. In werkelijkheid wil je waarschijnlijk een andere selectiemethode maken.
Not placed Rooms zullen foutmeldingen geven. Er zijn andere Nodes om dat probleem op te lossen.


Populaire berichten

Zoeken in deze blog