Pagina's op IkLeerBIM

vrijdag 11 september 2020

IFC: You don't know what you don't know - Until you do..

Johan Cruijff zou aan die uitspraak nog een puntje kunnen zuigen ;-) Maar voordat de ene helft van de lezers weer doorklikt en de andere helft zich ongemakkelijk gaat voelen de echte vraag. Weet je 'voldoende' over IFC? Want veel van ons werken wel met IFC: we maken IFC bestanden, we gebruiken IFC bestanden en sommigen praten alleen maar over IFC. Maar weten we eigenlijk wel voldoende? En als je een vraag hebt wat doe je dan?


Vandaag heb ik een oud Excel bestand eens opgepoetst om (weer) te delen met jullie. Op 24 november 2014 deelde ik op mijn blog IkLeerBIM een eerste tool om de mapping tussen Revit en IFC wat beter in de vingers te krijgen. Inhoudelijk zou ik deze tool niet meer aanraden en verwijs ik liever naar de Revit Standards. Maar wat ik nog steeds waardeer, is dat het me hielp, om de de structuur, mogelijkheden en beperkingen die IFC heeft, iets beter te leren kennen. Ik gebruikte daar 1 sheet voor, die IFC structuur heette. Het was best leuk om daar wat mee te spelen. En af en toe de hyperlinks naar de BuildingSmart documentatie te gebruiken. Daar vind je meer info en achtergronden. Behalve dan de belangrijke relatie met een MVD natuurlijk.

De inhoud is nog gebaseerd op IFC4 (4.0.0.0) En inmiddels zijn we al wat verder. Daarom heb ik de hyperlinks laten verwijzen naar IFC4 ADD2 TC1 (4.0.2.1) Na het volgen van een hyperlink kan je dan verder lezen over de huidige stand. Sommige zaken zijn in IFC4 nieuw toegevoegd en nu inmiddels al weer 'DEPRECATED'. En gaan zo langzamerhand over de houdbaarheidsdatum heen.

Misschien is deze download voor jou ook wel een leuk startpunt. Om spelenderwijs te leren, te klikken en te lezen in de BuildingSmart documentatie. Ontdek jij ook nieuwe benamingen die je nog nooit hebt gebuikt? Ontdek jij ook nieuwe plekken waar specifieke informatie eigenlijk hoort te staan? Ontdek jij misschien zaken die inmiddels al achterhaald zijn? En voordat we weer helemaal de andere kant doorschieten, check ook even de certificering.

Ik ben benieuwd.

vrijdag 4 september 2020

Spouwmuren in BIM

- zie ook mijn artikel op LinkedIn-

Graag hoor ik jullie mening over het volgende, maar voel je niet verplicht. 😉


Mijn vraag gaat over het zo goed mogelijk modelleren van een spouwmuur in Revit en het exporteren naar IFC.

Alles los modelleren kan natuurlijk altijd. Maar het kost stomweg meer tijd om te maken laat staan te onderhouden. En je kan die tijd ook besteden aan extra details bijvoorbeeld. Hierbij een klein onderzoekje of een gelijkwaardige kwaliteit ook op een snellere manier gemaakt kan worden, in Revit en met behulp van Parts. Zelf ben ik geen ‘gebruiker’ van de IFC data, dus of het functioneel gelijkwaardig is in andere toepassingen kan ik slecht zelf beoordelen, vandaar mijn vraag.

  1. Welke van onderstaande 3 opties is voor jou gebruik gelijkwaardig aan het ‘los modelleren’ van een spouwmuur?
  2. En als geen van onderstaande gelijkwaardig is, welke komt dan het dichtste in de buurt. Waarom?
  3. Levert dit onderzoekje nieuwe inzichten op – of is het toch beter om ‘los’ te modelleren en de extra kosten voor lief te nemen.

 p.s. Ik zag achteraf dat sommige data van de wand niet correct bleek te zijn |-(  Maar voor het principe maakt het niet veel uit. Dus ik heb het even zo gelaten.


           1.

Hieronder de basisuitvoering van een samengestelde wand in IFC.

Geen alternatieve tekst opgegeven voor deze afbeelding

 Visueel zijn er geen losse bladen zichtbaar. Wel zit er onder de Material-tab een lijstje met materialen waar de spouwmuur uit is opgebouwd inclusief dikte.

Geen alternatieve tekst opgegeven voor deze afbeelding


           2.

Hieronder een basis uitvoering met Parts in het bronbestand. En als IfcParts in de IFC. Het eerste wat opvalt is dat we nu echt de spouwbladen en materialen herkennen. En daarnaast dat de basiswand nog steeds aanwezig is. Deze bevat nog steeds alle oude data, behalve de Materialen Tab en de Material Property. In plaats daarvan zijn de bladen als Building Element Part aanwezig.

Geen alternatieve tekst opgegeven voor deze afbeelding

Parts missen standaard heel veel data. Maar die data is best toe te voegen met IFC parameters in Revit. En dat levert het volgende op.

Geen alternatieve tekst opgegeven voor deze afbeelding

Er zijn veel Properties gevuld. Maar FireRating, Load Bearing, Is External, Classification ontbreken. Die zijn ‘natuurlijk’ hetzelfde als het IfcObject waar de IfcPart deel van uit maakt. Veel Quantities lijken te ontbreken in Solibri. Solibri rapporteert alleen de Inhoud en de BoundingBox. Het host object heeft natuurlijk wel gewoon een lengte, hoogte en verschillende oppervlaktes in Solibri.


            3.

Maar je kan de met extra data gevulde Parts ook exporteren als eigen IFC objecten, zie hieronder.

Geen alternatieve tekst opgegeven voor deze afbeelding

De oorspronkelijke host ontbreekt dan wel. En in plaats daarvan zitten er alleen 2 IfcWalls in het model. Deze bevatten alle Properties die horen bij een IfcWall. (inclusief de gevulde Pset_WallCommon) Eventueel kan je nu ook de spouw filteren zodat deze niet meegaat in de IFC. Wat ontbreekt is de ‘BaseQuantities’ tab. Maar Solibri geeft wel gewoon zijn eigen Quantities. (Eventueel zou je extra Quantities uit het bronbestand mee moeten kunnen sturen.) Wat Solibri niet meer kan is de Area van openingen opgeven. Een eventuele IfcOpening ontbreekt ook echt. En er is dus ook geen relatie tussen bijvoorbeeld een kozijn en de wand waar deze in zit. Maar is dat nodig?

 Het enige verschil in de IFC export zit in het aanvinken van ‘Advanced \ Export parts as building elements’

Geen alternatieve tekst opgegeven voor deze afbeelding

Wat verder opvalt is de IfcName van de IfcWalls in de browserstructuur. Deze is met behulp van de IFC override parameter IfcName bepaald. En automatisch ingevuld met een script. Het is vrij eenvoudig om dit bijvoorbeeld terug te brengen tot alleen het materiaal. Bijvoorbeeld om de sortering in de IFC browser te vereenvoudigen.

Geen alternatieve tekst opgegeven voor deze afbeelding


Resume:

Voor een modellerende partij is het vaak handig om -tot op zekere hoogte- met samengestelde objecten te werken. Door het maken van Parts en deze (geautomatiseerd) van extra IFC data te voorzien kan er direct een IFC worden gemaakt met losse objecten. Of juist als IfcPart onderdeel van een host. De laatste 2 opties hebben hun eigen specifieke voor en nadelen.


voor meer info:

https://github.com/Autodesk/revit-ifc/issues/120

https://github.com/Teun1/Revit-Parts-to-IFC

Voorbeeld bestanden

dinsdag 5 mei 2020

Update IkLeerBIM Dynamo Package

Just added 2 extra nodes: API.MethodLookUp and API.FilterScriptGenerator.
And in the extra directory is also an example.dyn file for a Quick start.


The whole goal of this Package is to help people who are already familiar with Dynamo. And understand how to make a for loop in Python. So they can find their way with the (Revit) API as comfortable as possible. You can search the internet later. Most Dynamo users will come to this point where they need to build just a little Python script because there is no Node available. Or they need to speed up a Dynamo script just a little.

To do this I needed to add 2 more Nodes:

API.FilterScriptGenerator 

Will help you with your second problem: "How to grab elements from the Revit Database?" You can use the Dynamo Nodes off course. But can you do without? Now you can. And very easy. This Node will generate a complete Python Script. Copy this to clipboard, with a Node from Clockwork or Rhythm. Paste it in a Python Node. And tweak it to your needs.

API.FilterScriptGenerator

But, "The FilterElementCollector is no rocket science." I hear you say. No it isn't.
Still this Node has almost every option that the API gives us. And there are quite a few...
Beside filtering on 1 or multiple Classes or BuiltinCategories, you can Filter on all the Parameters you want. Use Views, Levels, Geometry and DesignOptions. And there is also an option so your Python Node also works for Linked documents.

Some Filter options can be achieved in multiple ways. If that is the case I tried to choose 1 or the other. I also skipped some very specialized Filters, because it is possible to also use e.g. BuiltinCategories. Most of this is documented in the Node.
And for those who know their stuff. This is not the most beautiful, clean and efficient script I ever wrote. But it works. ;-) So perhaps I will clean it up later (if I want to).


API.MethodLookUp 

Helps to find the arguments needed for a method. In al lot of cases this will be enough. And if this is still confusing you can always use google and find more examples or an explanation.
API.MethodLookUp
With Lacing Longest and some sorting and grouping.


woensdag 15 april 2020

First release IkLeerBIM Dynamo API helper (micro) Package

While writing Python code in Dynamo I still seem to use my own LookUp Node a lot. And that is despite multiple very appreciated well known tools and websites. All these work best, because a lot of people did contribute their little something. That's how this train moves. So today I want to contribute my tiny little something.


But why do I use this LookUp Node and not something else?
First of all every situation is different. And everybody works differently. But most of the time I simply do not want to leave my scripting environment. And that is Dynamo. Secondly I want to know what actually works - no surprises. And remember I am foremost a Revit user, so the way I approach a Revit problem might be slightly different than a professional programmer. And this Node is a real easy and straight forword way of working with Python in Dynamo.

Really world changing technology right? 
Ahh not exactly... It is more like a smart dir() function, with some extra. But .. it works. Simply give the Node something to chew on. And it will return all the attributes with values, all methods, all BuiltinParameters with values, the BuiltinCategory and the Class. It is possible to search, clean or even extend the outcome with readable names. I would say, give it a try. I love it, it might work for you too.


Thanks to the community who provides countless means to examine and learn new things. Parts of the code came from everywhere. Like the Clockwork Package, Dynamo Forum, The Building Coder etc. Thanks all. This is my small contribute back.


Just a few teasers on what this node does.
And remember, this Node is basically a temporary LookUp node. It is not build to use it as a part of script. But why would you. Use it to build your own Python script. Have fun.

This node eats almost everything and shows the class of the input

Just give this node a list or a single item. It will flatten everything and uses only the first index. 

It will clean the output for empty / null etc. values. Unless you want to see everything off course. 

Sometimes you simply want readable names. But most of the times you do not...


Because it slows down a little.
And if you know what you are looking for, you simply use the Case Insensitive search.

vrijdag 6 december 2019

Fun with heatmaps

Today something fun, and who knows useful.

In an age of generative design a heat map can give a human perhaps a different kind of insight.
A heat map is as a surface with a colored gradient. And the colors represent a value, or even a wright and a wrong. The nice thing about a colored gradient is that the computer does the interpolation based on the actual calculated values. Off course in real life some of those values are not valid. And of course it is a very rough way to make decisions. But it does give some visual feedback. And it is based on calculations and not rules of thumb.
So let’s do this!. And make some heat maps in Dynamo and Revit. See what happens. And what works.


First Dynamo
For a heat map you  first need a surface. So let’s select a Face from an object in Revit.
Now the first thing you need to know about generating a heat map in Dynamo is that you need a matrix (list of list) of points. The list of list must be with the same lengths and offsets. So in normal language. Create a bounding box based on the surface. Convert this into real geometry. Explode this to grab the bounding surface. And that is where we are going to work with.  We divide this new surface into points. This can easily be done with Surface.PointAtParameter based on a UV. Both the U and the V are lists between 0 and 1 with equal steps for both in the U and in the V directions. The UV is like the local coordination system for the new heat map. The generating heat map needs this environment to work correct in Dynamo. Some points are on the Surface and some are not. This works differently in Dynamo and in Revit. But we will get back on that later.
So we have a surface and a list of list of points. Based on a bounding UV system.


Now let’s make Dynamo work!
Just for starters we will calculate the distance between each of these points and another object in Revit. In order to map each value to a colour in a color range between 0 to 1, we also need to map all the values between 0 and 1. Now we can find the right color for each value with the Color Range Node. At this moment each distance has a corresponding color. And this color is related to a UV position on the bounding surface because of the list structure. So when we connect this list of list of colors to the surface. We get a correct heat map. Points outside the surface do not matter for the GeometryColor.BySurfaceColors Node. Actually this Node needs all the UV points of the 2D bounding box to work correctly.


When we move the object in Revit the heat map in Dynamo will change. Nice… :-)
Off course we can also tweak the color range a little. The indices do not to be equally divided between 0 and 1. As long as there are as many colors as indices it will continue to work.


Because it is still a list of list with values. You can do some simple math and relate multiple heat maps to each other. Like the points nearest to object 1 AND object 2. Or the points nearest to object 2 and greatest distance to object 1. Off course this examples are not really difficult. I simply show how this works.

Now let’s take this heat map to Revit.


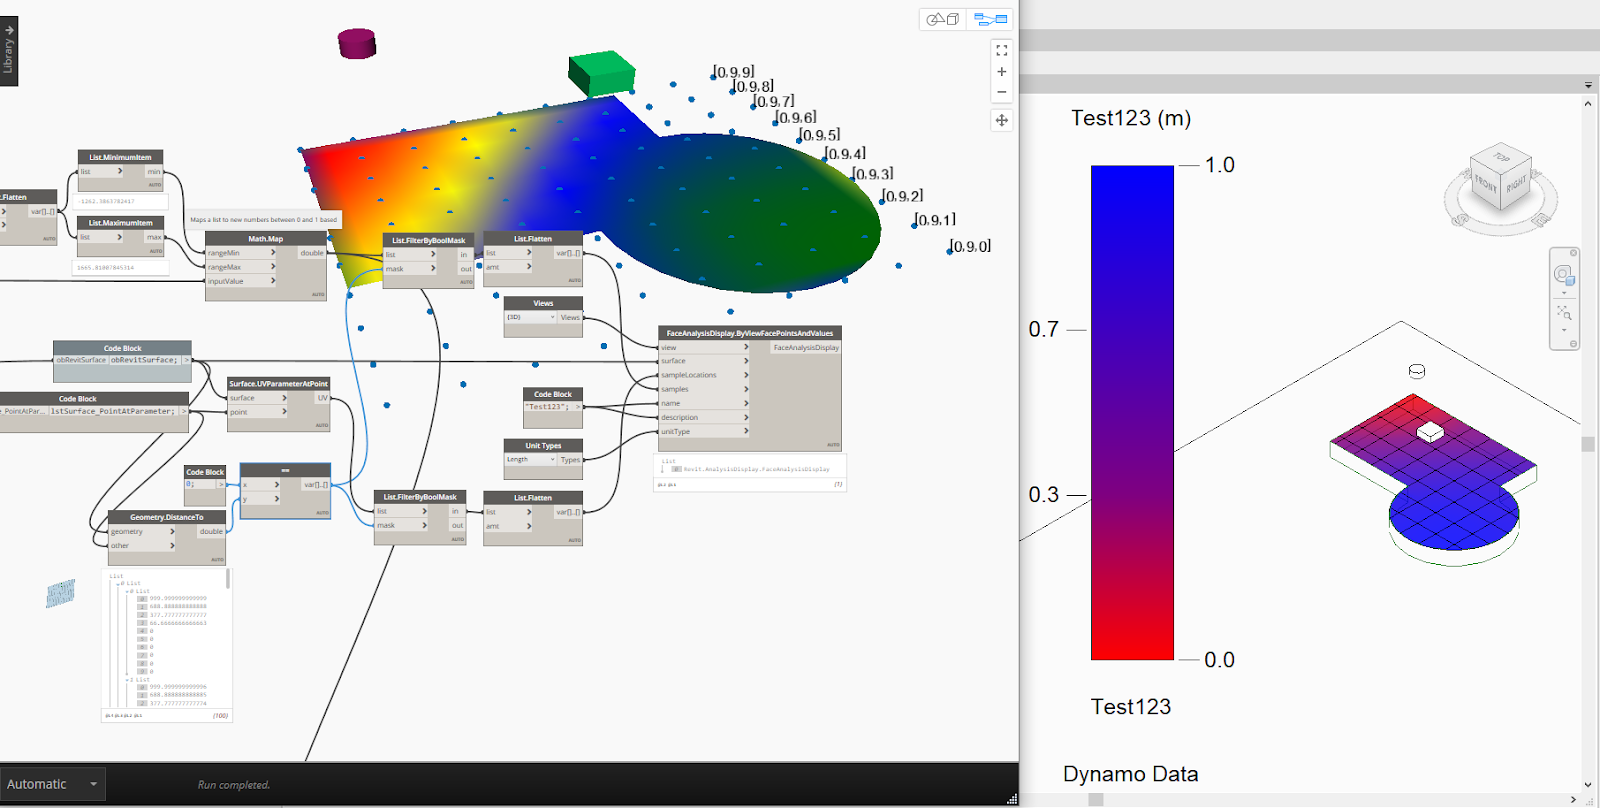
If we want to use the same points and values to create a heat map in Revit it does not work. We need to filter for points that are actually on the surface. This is the first thing  that is different. And another thing is that we need a flatten list.


Of course Revit has its own View Visibility settings that also need to be correct to show the heat map. We need to create (or select) a Graphic Display Style – you can try different settings-. Be sure that Analysis Result Settings are also set. Also be sure that your kind of view is able to show the heat map –like 3D views-


Back to Dynamo.
There is more we can do while visualizing our calculated data. What about getting the contour of an area that is better (or worse) than a specific value? That is an interesting concept, I think. Because In the end you want the computer to understand that we are pinpointing things to a specific area that make sense. Jus in order to (visually) lower the endless combinations in front, while doing some generative design.
It gives us also other ways to visually or mathematically examine our results. Like the value at a specific point, based on interpolation. Or the slope – the difference between values in an bigger or smaller area. There are times that you best can generate millions of options –because it is simply too difficult to explain or program- And there are times when you are trying to find an optimum between the latest and doing things completely manually.

To do this we can e.g. create a 3D visualisation of the values and generate new meaningful geometry based on our wishes. Let’s start this by creating new points, based on the original grid of points and an Z-offset, based on the value of each point.  You can create lines while connecting the original to the new points. Or create nurbscurves while using only the new points in the list of list. Some points will intersect because they do not have a ‘value’ so if you want to, you can filter those, or simply ignore the warning.


Create a solid while using the perimeter curves of the original surface and the new top surface.
And finally slice this new solid at a certain level.
Now we have a new piece of geometry that is roughly defined by calculations off a grid of points and a value filter. The slicer is not really fast... but it works.


Of course this is not all new.
ArchiLab has also some nodes. Here is an old post where he is playing with LadyBug and Mantis Shrimp

And then there is the SpaceAnalysis Package. Build by Autodesk Research. A package that can do some efficient tricks just out of the box. It has some wonderful solutions for Pathfinding (better than calculating the straight line distance in our example)), Visibility / Field of view and Acoustics.


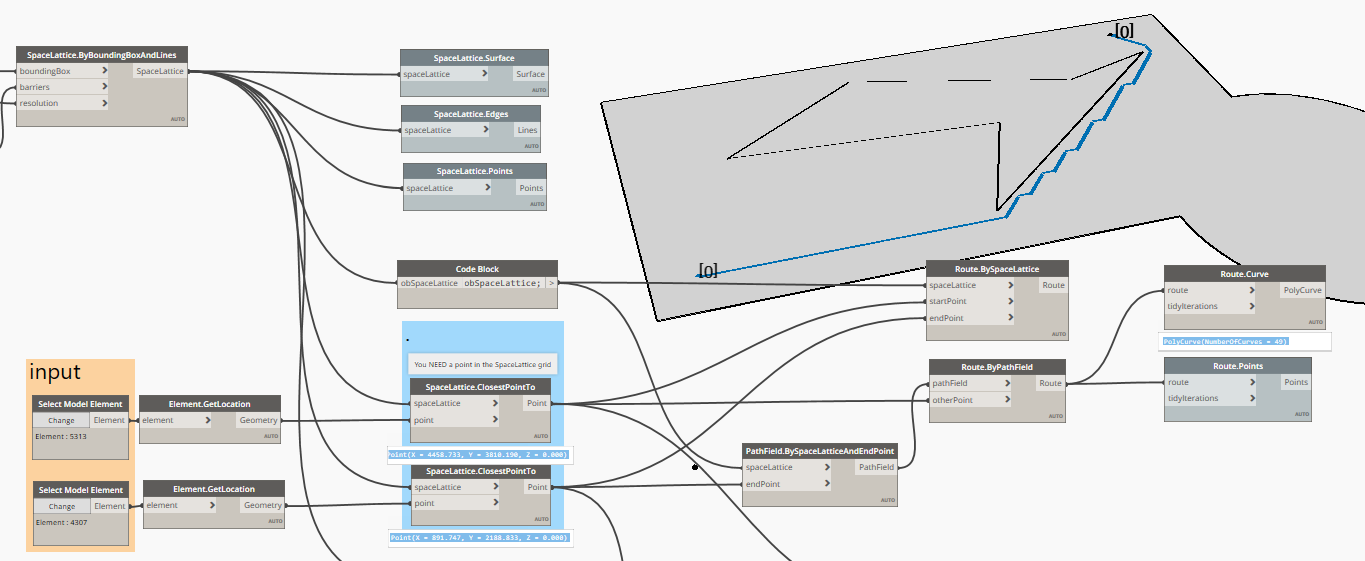
I am happy to say that it is not really difficult to use. First you have to make a Space Lattice with the Node SpaceLattice.ByBoundingBoxAndLines. This node needs a bounding box (now you know), some barriers (real barriers, or the contour of the surface, or an empty list – but why would you) It is possible to enter a list of Revit lines, but also line based Revit families. Remember that curved lines do not work. In that case use Utils.ApproximateCurvesWithLines. And last but not least a resolution input. Take care of this one! This is a distance input and the default value is 0,2. Beware! Your script will probably not break. And when this node is finally finished you have a very detailed Space Lattice. When you first try this workflow make this input bigger than the default. Or try something like I did to reduce the points.


There are a few nodes that will show this Space Lattice. It contains of a grid of points. And all the points are connected with lines in maximum 8 directions. By walking and counting these lines you will have an idea how far points are apart. Especially if you see that the Space Lattice does not make these lines if they intersect with your barriers. Well in the end the shortest path is a fundamental science problem. Google Dijkstra’s algorithm if you are up to it. It can be fun to know at least some basics.


Because of this Space Lattice, you have to relate your input points to this Space Lattice with the node SpaceLattice.ClosestPointTo. At least that is what I think is best.


It is easy to find and visualize the shortest path. A nice addition is the tidyIteration to make the path more smooth. You probably want to do this if you do not use so much calculating points.


The field of view is only a few nodes. Here it is also possible to relate multiple results by using Union and Intersection. And there is also a node to get the value at a specific point.

Of course you need to do some tricks to get this visual into Revit, as described above.


Here you can find the scripts SpaceAnalysis_test.dyn and Heat_map_test.dyn so you play around.

Populaire berichten

Zoeken in deze blog